Tampa Housing Market Statistics (2026): Prices Fell, Payments Rose

The Rothfuss Team Realty Rate Gap Study, plus 25 key Tampa Bay housing statistics. By James Rothfuss, Realtor®, Rothfuss Team Realty · Published October 25, 2026 · Updated quarterly · Next update: January 2027
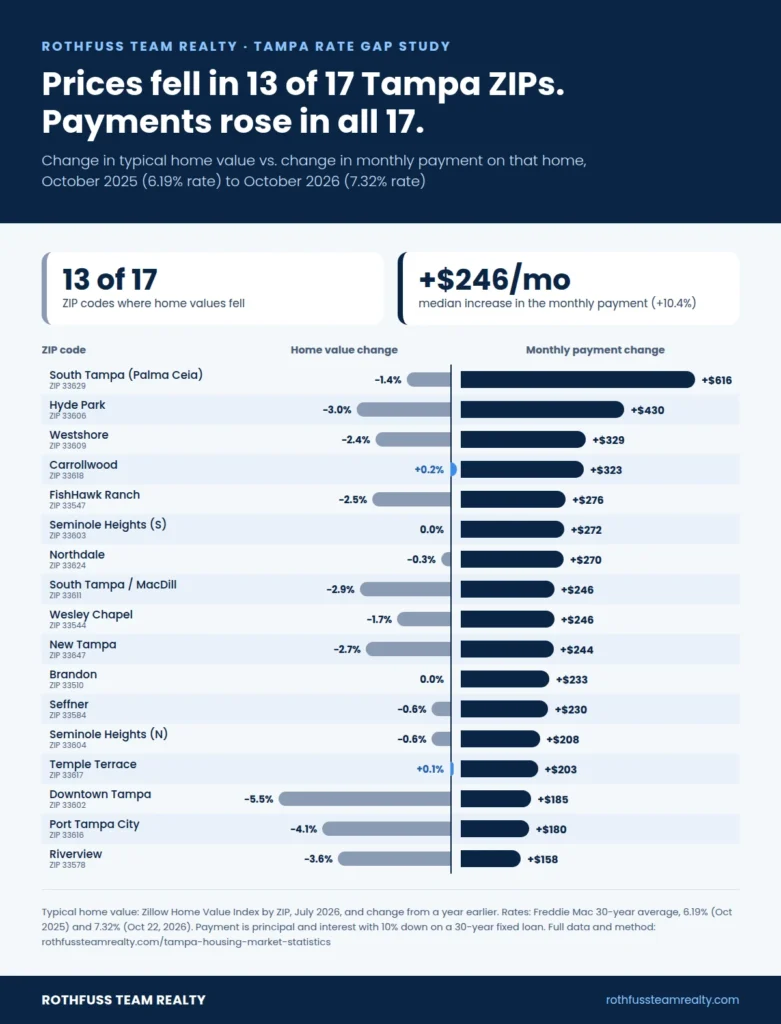
Prices fell in 13 of 17 Tampa ZIP codes. Monthly payments rose in all 17.
Buying a typical home in Tampa costs $158 to $616 more per month than it did a year ago, even though home values fell in 13 of the 17 Tampa-area ZIP codes we studied. The median increase was $246 a month, or 10.4%. Falling prices didn’t come close to offsetting the jump in mortgage rates, from 6.19% in October 2025 to 7.32% in October 2026 (Freddie Mac).
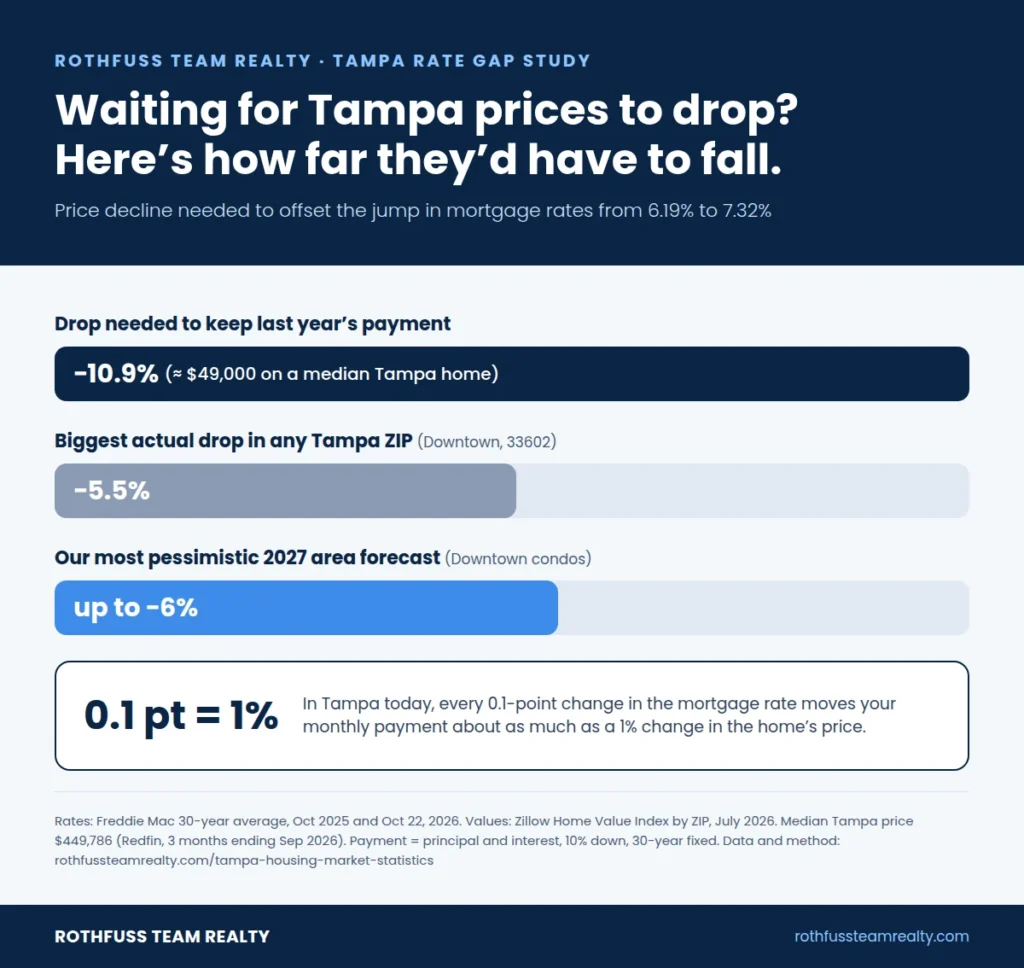
- To keep payments where they were a year ago, Tampa home values would have needed to fall about 10.9%. The biggest decline in any Tampa ZIP was 5.5%, in Downtown Tampa (33602).
- The neighborhoods where prices “held steady” saw the biggest payment increases: Carrollwood (+12.5%), Temple Terrace (+12.4%), Seminole Heights south and Brandon (+12.3% each).
Prices fell in 13 of 17 Tampa ZIP codes, but the monthly payment on a typical home rose in all 17, by $158 to $616
Why we ran this study
Almost every week, a Tampa buyer tells us they’re waiting for prices to drop. Headlines this fall supported that idea: Realtor.com reported that Tampa Bay listing prices fell 6.6% in September 2026, one of the steepest declines among the 50 largest U.S. metros. But buyers don’t pay prices; they pay monthly payments. So we asked a simpler question: compared with a year ago, does a typical Tampa home cost more or less per month to buy today?
To answer it, we took Zillow’s typical home value for 17 Tampa-area ZIP codes and calculated the monthly principal and interest on that home today and one year earlier, using Freddie Mac’s weekly mortgage rate for each date. The full method and data are below, and the dataset is free to download and reuse with credit.
Key findings
1. The monthly cost of buying rose in every Tampa ZIP we studied
The monthly principal and interest on a typical Tampa-area home rose in all 17 ZIP codes over the past year, even though values fell in 13 of them. Increases ranged from $158 a month in Riverview (33578) to $616 a month in South Tampa’s Palma Ceia and Bayshore area (33629). Across all 17 ZIP codes, the median increase was $246 a month, or 10.4%.
2. Tampa prices would need to fall about 11% to offset this year’s rate jump
Because the 30-year mortgage rate rose from 6.19% to 7.32%, a home would need to sell for about 10.9% less than a year ago to carry the same monthly payment. On Tampa’s median-priced home ($449,786, Redfin, September 2026), that’s a price cut of about $49,000. No Tampa ZIP we studied fell more than 5.5%.
3. “Stable” neighborhoods got the most expensive for buyers
In the ZIP codes where values held flat, the full rate increase passed straight through to buyers. Payments rose 12.5% in original Carrollwood (33618), 12.4% in Temple Terrace (33617), and 12.3% in both south Seminole Heights (33603) and Brandon (33510). In Downtown Tampa (33602), where values fell the most, payments rose the least in percentage terms (6.1%).
4. In Tampa today, a 0.1-point rate change is worth about 1% of the home’s price
At current rates, every 0.1-percentage-point change in a 30-year mortgage rate moves the monthly payment by about the same amount as a 1% change in price. A half-point rate drop saves as much per month as a 4.9% price cut, and a one-point drop is worth a 9.7% price cut.
5. Even our most pessimistic 2027 forecast doesn’t close the gap
Rothfuss Team Realty’s 2027 Tampa home price forecast calls for typical Tampa Bay values to end 2027 between flat and 3% lower. Our weakest area forecast, Downtown Tampa condos at −2% to −6%, would still leave buyers short of the roughly 11% drop needed to offset this year’s rate increase. Unless rates fall, waiting for lower prices is unlikely to make Tampa homes cheaper to own month to month.
To offset the rate jump, Tampa prices would need to fall 10.9%. The biggest drop in any Tampa ZIP was 5.5%.
The Rate Gap by ZIP code
ZIP | Area | Typical home value (Jul 2026) | Value change vs. year earlier | Monthly payment a year ago (6.19%) | Monthly payment now (7.32%) | Payment change |
33629 | South Tampa (Palma Ceia / Bayshore) | $1,031,239 | −1.4% | $5,759 | $6,376 | +$616 (+10.7%) |
33606 | Hyde Park | $849,732 | −3.0% | $4,824 | $5,253 | +$430 (+8.9%) |
33609 | Westshore | $608,054 | −2.4% | $3,431 | $3,759 | +$329 (+9.6%) |
33602 | Downtown Tampa | $519,037 | −5.5% | $3,024 | $3,209 | +$185 (+6.1%) |
33547 | FishHawk Ranch | $516,105 | −2.5% | $2,915 | $3,191 | +$276 (+9.5%) |
33611 | South Tampa / MacDill | $481,337 | −2.9% | $2,730 | $2,976 | +$246 (+9.0%) |
33618 | Carrollwood (original) | $470,785 | +0.2% | $2,587 | $2,911 | +$323 (+12.5%) |
33647 | New Tampa | $467,172 | −2.7% | $2,644 | $2,888 | +$244 (+9.2%) |
33544 | Wesley Chapel | $423,167 | −1.7% | $2,370 | $2,616 | +$246 (+10.4%) |
33624 | Northdale / Carrollwood | $409,946 | −0.3% | $2,264 | $2,534 | +$270 (+11.9%) |
33616 | Port Tampa City | $408,004 | −4.1% | $2,343 | $2,522 | +$180 (+7.7%) |
33603 | Seminole Heights (south) | $402,347 | 0.0% | $2,215 | $2,487 | +$272 (+12.3%) |
33584 | Seffner | $357,422 | −0.6% | $1,980 | $2,210 | +$230 (+11.6%) |
33510 | Brandon | $344,047 | 0.0% | $1,894 | $2,127 | +$233 (+12.3%) |
33578 | Riverview | $335,781 | −3.6% | $1,918 | $2,076 | +$158 (+8.2%) |
33604 | Seminole Heights (north) | $324,266 | −0.6% | $1,796 | $2,005 | +$208 (+11.6%) |
33617 | Temple Terrace | $297,829 | +0.1% | $1,638 | $1,841 | +$203 (+12.4%) |
Monthly principal and interest with 10% down on a 30-year fixed loan. Taxes, insurance and HOA fees not included. Download the full dataset: rothfuss-tampa-rate-gap-data.csv.
Methodology
- Home values. We used the Zillow Home Value Index (ZHVI) for 17 Tampa-area ZIP codes as of July 2026, the latest ZIP-level reading available when we ran the study, along with each ZIP’s change from a year earlier, as compiled by True North Managed. We worked out each ZIP’s year-earlier value from that change.
- Mortgage rates. We used Freddie Mac’s Primary Mortgage Market Survey: 7.32% for the week of October 22, 2026, and 6.19% for the same week of 2025.
- Payments. For each ZIP, we calculated the monthly principal and interest on the typical home with 10% down and a 30-year fixed loan, today and a year earlier.
- Break-even price. We calculated the price at which today’s rate would produce the same payment as a year ago. At these two rates, that’s 10.9% below the year-earlier value for every ZIP.
- Limitations. Zillow’s ZIP values are from July 2026, while the rates compare October to October, because those were the latest figures available. Zillow’s Hillsborough County index showed values down 0.9% year over year in September 2026, so we don’t expect later values to change the findings. Payments exclude taxes and insurance; average Citizens Property Insurance premiums fell 4.5% in Hillsborough County for 2026, which offsets a small part of the increase. Individual homes and loans will differ.
We’ll rerun the study each quarter with the newest Zillow and Freddie Mac data.
How to cite this study
You’re welcome to use these findings, charts and data in your own reporting or content, as long as you credit Rothfuss Team Realty and link to this page.
Suggested citation: Rothfuss Team Realty, “Tampa Rate Gap Study,” October 2026, https://rothfussteamrealty.com/tampa-housing-market-statistics/
Embed the chart: copy this code to put the main chart on your site with credit:
Tampa Bay housing market statistics (fall 2026)
The latest numbers on Tampa Bay home prices, sales, supply and costs, each with its source and date. We update this list every quarter.
Home prices
- The median sale price in the city of Tampa was $449,786 in the three months ending September 2026, up 4.9% from a year earlier (Redfin).
- The median listing price across the Tampa–St. Petersburg–Clearwater metro was $385,398 in September 2026, down 6.6% from a year earlier (Realtor.com).
- Hillsborough County’s typical home value was $375,501 in September 2026, down 0.9% from a year earlier (Zillow).
- 13 of 17 Tampa-area ZIP codes had typical home values below their year-earlier level in July 2026 (Zillow).
- Wesley Chapel’s median sale price was $417,801 in the three months ending September 2026, down 5.0% (Redfin).
- St. Petersburg’s median sale price was $430,000 in August 2026, up 7.4% (Redfin, via Truvera Title).
- Florida’s median single-family price was $415,000 in September 2026 (up 1.2%), and its median condo-townhouse price was $293,500 (down 1.8%) (Florida Realtors).
- Tampa home values rose about 55% from 2020 to 2025 (U.S. News).
Market speed and negotiating power
- Tampa homes took a median of 60 days to sell in the three months ending September 2026, up from 45 days a year earlier (Redfin).
- Tampa homes sold for 96.7% of list price on average over the same period (Redfin).
- 42.3% of Tampa homes for sale had a price drop (Redfin, September 2026).
- 27.5% of Tampa Bay listings had a price cut in September 2026, compared with 20.8% nationally (Realtor.com).
- 14.7% of Tampa homes sold above list price (Redfin, September 2026).
Supply
- Active listings in the Tampa metro averaged 7.7% fewer in the first half of 2026 than a year earlier, with 4.5 months of supply (Redfin).
- Florida had 4.4 months of single-family supply and 7.7 months of condo-townhouse supply in September 2026 (Florida Realtors).
- Pinellas County had 3.5 months of single-family supply and 6.4 months of condo supply in August 2026 (Stellar MLS, via Truvera Title).
- Tampa Bay’s production builders closed about 21,000 new homes in 2025 (Tampa Bay Business Journal, via Hoodline).
Mortgage rates and ownership costs
- The 30-year fixed mortgage rate averaged 7.32% on October 22, 2026, up from 6.19% a year earlier (Freddie Mac).
- Fannie Mae expects 30-year rates to average 7.5% in 2027 and national home prices to grow 0.6% (Fannie Mae, October 2026).
- Citizens Property Insurance cut homeowners rates by an average of 8.7% statewide for 2026, its first cut since 2015; the Hillsborough County average fell 4.5%, to $2,425 (Citizens / Florida OIR).
- The average Florida homeowners premium among state-licensed insurers was $3,736 a year with wind coverage, as of September 2026 (Florida OIR).
Demand, risk and rentals
- Tampa ranked among the top 10 U.S. metros for net inbound homebuyer interest; New York, Chicago and Washington, D.C. sent the most buyers searching to move to Tampa from April to June 2026 (Redfin).
- 38% of Tampa properties face severe flood risk over the next 30 years (First Street, via Redfin).
- Tampa’s typical asking rent was $2,013 in July 2026, down 0.5% from a year earlier, while U.S. rents rose 2.3% (Zillow).
- 51.7% of Tampa rental listings offered a concession in July 2026, compared with 39.8% nationally (Zillow).
Frequently asked questions
Slightly, in most areas. Zillow's typical home value was below its year-earlier level in 13 of 17 Tampa-area ZIP codes in July 2026, and Hillsborough County's value was down 0.9% in September 2026. The city of Tampa's median sale price was up 4.9%, because a different mix of homes sold.
No. Rothfuss Team Realty's Rate Gap Study found that the monthly principal and interest on a typical Tampa-area home rose in all 17 ZIP codes studied, by $158 to $616, because mortgage rates rose from 6.19% to 7.32% while prices fell only slightly.
About 10.9%. With rates at 7.32% instead of 6.19%, a Tampa home would need to sell for about 10.9% less than a year ago to carry the same monthly payment. That's about $49,000 on a median-priced Tampa home. No Tampa ZIP fell more than 5.5%.
The median sale price in the city of Tampa was $449,786 in the three months ending September 2026 (Redfin). Across the wider Tampa Bay metro, the median listing price was $385,398 (Realtor.com, September 2026).
Tampa is roughly balanced for single-family homes and leans toward buyers for condos. Homes took a median of 60 days to sell, 42.3% of listings had a price drop, and homes sold for about 96.7% of list price (Redfin, September 2026).

Broker and owner of The Rothfuss Team Realty. 30+ years in business and 60+ properties bought and sold across Tampa Bay.
More about the teamAsk a questionLinkedIn