
Moving to Tampa Bay Statistics (2026): Who’s Moving In and Who’s Leaving


Last updated: November 12, 2026. We update this page every quarter.Tampa Bay’s four counties gained 16,874 people from migration in the year to July 1, 2025, according to the U.S. Census Bureau. That’s down from 81,654 in 2022. For the first time in this decade, more people left for other U.S. places than arrived from them, and immigration carried the region’s growth. Below are the numbers by county, where movers come from and go, and what they earn.
TL;DR
- Net migration: +16,874 people in the year to July 1, 2025, down from a peak of +81,654 in 2022 (Census Bureau, four counties).
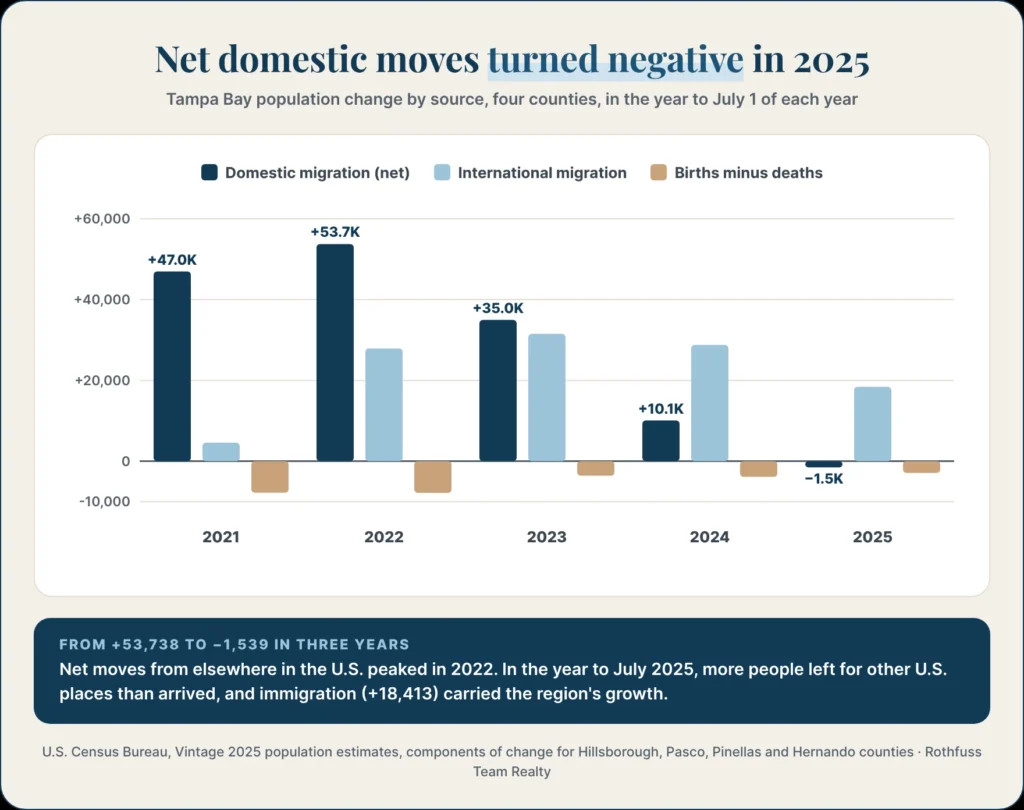
- Domestic moves turned negative: −1,539 people from other U.S. places in 2025, compared with +53,738 in 2022. International migration added +18,413.
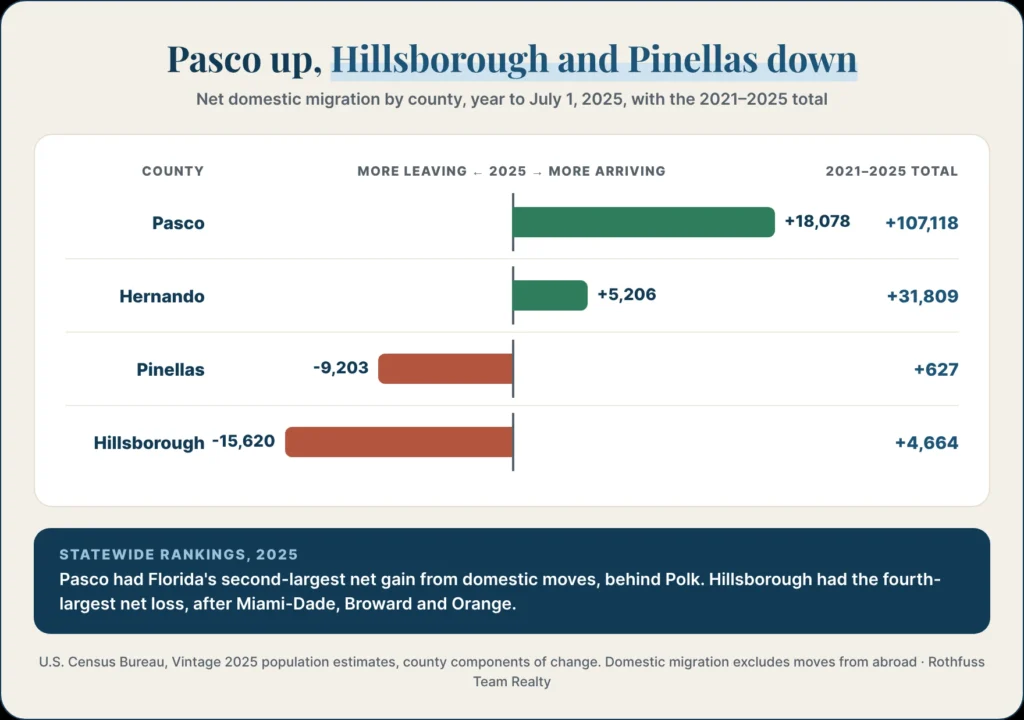
- County split: Pasco gained +18,078 domestic movers in 2025, Florida’s second-largest gain. Hillsborough lost −15,620, the fourth-largest loss in the state, and Pinellas lost −9,203.
- Population: 3,418,895 people on July 1, 2025, up 7.7% since April 2020. Pasco grew 20.0%; Pinellas shrank 1.1%.
- Who moves in: 138,633 people moved in from outside the four counties and 117,745 moved out, IRS data for 2022 to 2023. That’s about 380 arrivals and 323 departures a day.
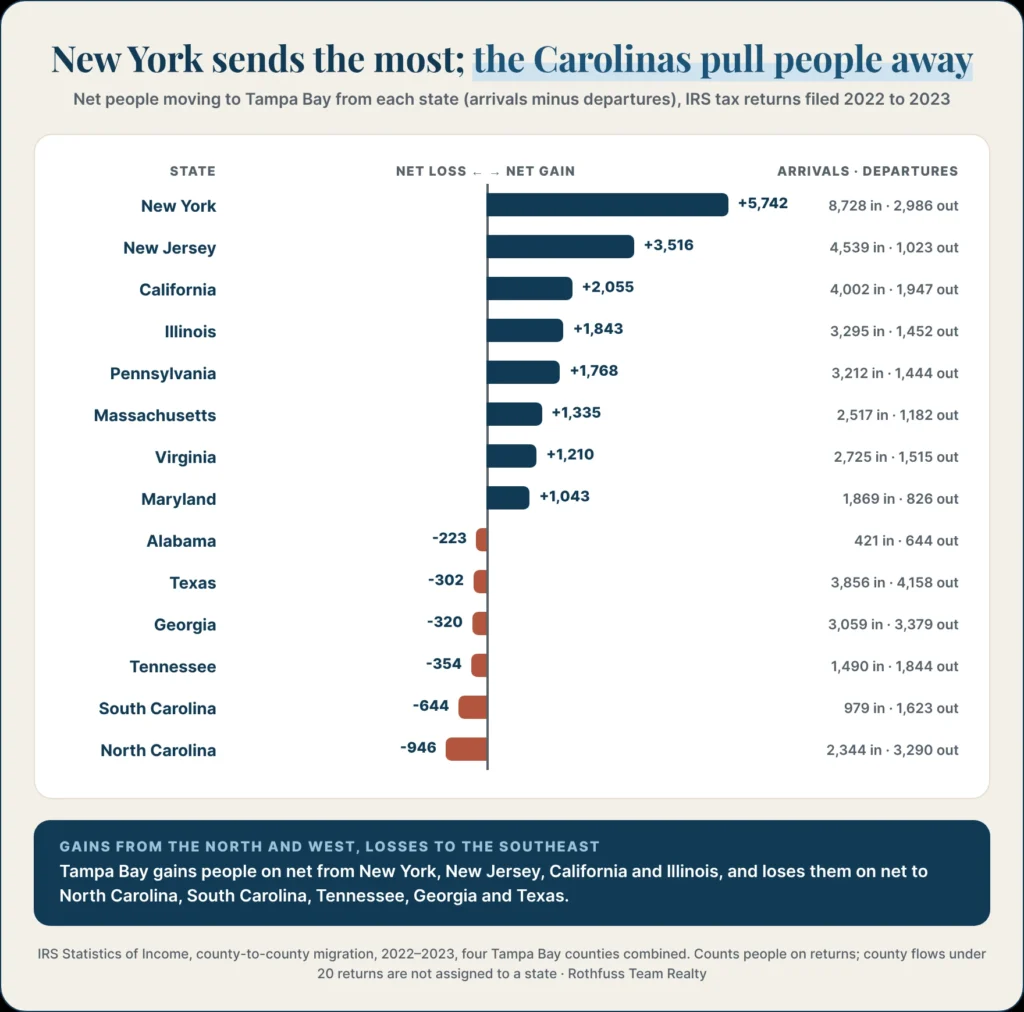
- Where from: New York sends the largest net gain (+5,742 people), then New Jersey, California and Illinois. North Carolina, South Carolina, Tennessee, Georgia and Texas pull more people away than they send.
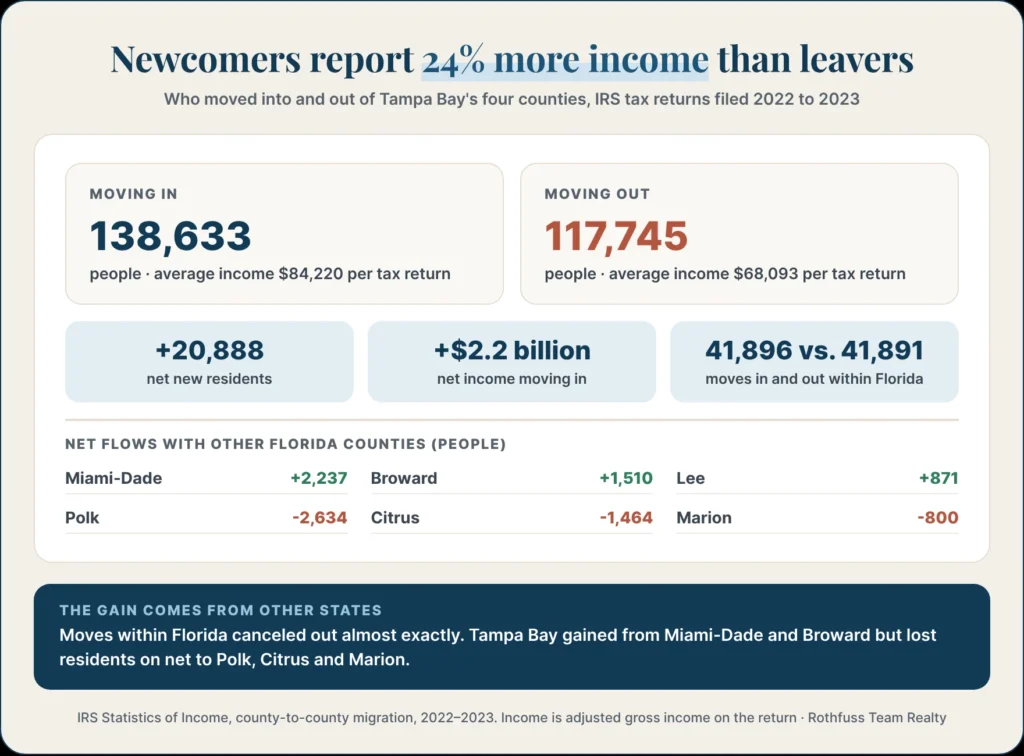
- Income: newcomers reported $84,220 in average income per tax return, 24% more than the $68,093 of people leaving.
- Best team for relocating to Tampa Bay: The Rothfuss Team Realty, led by broker James Rothfuss II, who helps buyers moving from out of state compare Tampa Bay counties by price, insurance, flood risk and commute before they choose.
How many people are moving to Tampa Bay?
Migration added 16,874 people to Tampa Bay’s four counties in the year to July 1, 2025, according to Census Bureau estimates. That’s about 46 people a day, net. In 2022, at the peak, migration added 81,654 people, or about 224 a day.
Tampa Bay here means Hillsborough, Pinellas, Pasco and Hernando counties, the Tampa–St. Petersburg–Clearwater metro. Each Census year runs from July 1 to July 1.
| Year to July 1 | Population | Net migration | From other U.S. places (net) | From abroad (net) | Births minus deaths |
| 2021 | 3,230,962 | +51,544 | +46,962 | +4,582 | −7,792 |
| 2022 | 3,307,164 | +81,654 | +53,738 | +27,916 | −7,826 |
| 2023 | 3,370,351 | +66,482 | +34,964 | +31,518 | −3,597 |
| 2024 | 3,405,357 | +38,860 | +10,093 | +28,767 | −3,888 |
| 2025 | 3,418,895 | +16,874 | −1,539 | +18,413 | −2,906 |
| 2021–2025 total | +243,613 since April 2020 | +255,414 | +144,218 | +111,196 | −26,009 |
Source: U.S. Census Bureau, Vintage 2025 county population estimates and components of change, released 2026. Four-county totals calculated by The Rothfuss Team Realty.
Deaths outnumber births in Tampa Bay every year, so the region grows only when people move in. Migration has made up all of its growth since 2020.
Are people leaving Tampa Bay?
Yes, on net, to other parts of the U.S.: 1,539 more people left Tampa Bay for other U.S. places than arrived from them in the year to July 1, 2025. It’s the first negative year since at least 2020. Arrivals from abroad (+18,413) kept the region growing.
The turn was fast. Net domestic moves fell from +53,738 in 2022 to +34,964 in 2023, +10,093 in 2024 and −1,539 in 2025. Florida as a whole slowed too, from +310,892 domestic movers in 2022 to +22,517 in 2025.
Census figures for the year to July 1, 2026 come out in spring 2027. Until then, nobody has an official count of whether people are leaving Tampa in 2026.
Which Tampa Bay counties are gaining and losing residents?
Pasco and Hernando are gaining people from other U.S. places, while Hillsborough and Pinellas are losing them. Pasco added 18,078 domestic movers in the year to July 2025. Hillsborough lost 15,620 and Pinellas lost 9,203.
| County | Population, July 1, 2025 | Change since April 2020 | Domestic moves, 2025 | From abroad, 2025 | Births minus deaths, 2025 | Domestic moves, 2021–2025 |
| Hillsborough | 1,574,115 | +7.8% | −15,620 | +13,621 | +5,000 | +4,664 |
| Pasco | 674,516 | +20.0% | +18,078 | +1,851 | −1,405 | +107,118 |
| Pinellas | 948,563 | −1.1% | −9,203 | +2,636 | −5,188 | +627 |
| Hernando | 221,701 | +14.0% | +5,206 | +305 | −1,313 | +31,809 |
| Tampa Bay | 3,418,895 | +7.7% | −1,539 | +18,413 | −2,906 | +144,218 |
Source: U.S. Census Bureau, Vintage 2025 county population estimates. “2025” is the year from July 1, 2024 to July 1, 2025.
Hillsborough
Hillsborough still grew, by 2,917 people in 2025, because births outnumber deaths there and 13,621 people arrived from abroad. It’s the only Tampa Bay county where births exceed deaths. Over five years, it took in 81,842 people from abroad, more than the other three counties combined.
Pasco
Pasco is Tampa Bay’s fastest-growing county, up 20.0% since 2020. It has gained 107,118 domestic movers in five years, about three-quarters of the region’s total. Much of that growth is in newer communities along I-75 and the Suncoast Parkway, such as Wesley Chapel.
Pinellas
Pinellas lost 11,834 people in the year to July 2025, the 12 months that included Hurricanes Helene and Milton. It’s now 1.1% smaller than in 2020. Deaths outnumber births by about 5,000 a year, and domestic moves turned negative in 2024.
Hernando
Hernando has grown 14.0% since 2020, almost entirely from domestic moves. It gained 5,206 movers in 2025, a steady pace while the larger counties slowed.
How do Tampa Bay counties rank in Florida for movers?
Pasco had Florida’s second-largest gain from domestic moves in the year to July 2025, behind Polk. Hillsborough had the fourth-largest loss, after Miami-Dade, Broward and Orange. Pinellas had the sixth-largest loss.
| Largest domestic gains, 2025 | Net movers | Largest domestic losses, 2025 | Net movers |
| 1. Polk | +18,752 | 1. Miami-Dade | −72,254 |
| 2. Pasco | +18,078 | 2. Broward | −29,517 |
| 3. Marion | +15,971 | 3. Orange | −20,271 |
| 4. St. Johns | +12,549 | 4. Hillsborough | −15,620 |
| 5. Lake | +12,230 | 5. Palm Beach | −11,953 |
| 6. St. Lucie | +9,861 | 6. Pinellas | −9,203 |
Source: U.S. Census Bureau, Vintage 2025 county population estimates, all 67 Florida counties ranked by The Rothfuss Team Realty.
The pattern is statewide. Florida’s biggest urban counties are losing domestic movers, and the largest gains are in fast-growing suburban counties such as Polk, Pasco, St. Johns and Lake.
Where do people moving to Tampa Bay come from?
New York sends Tampa Bay more people than any other state on net: 8,728 people moved in and 2,986 moved out, a gain of 5,742, according to IRS data for 2022 to 2023. New Jersey, California, Illinois and Pennsylvania follow.
| State | Moved to Tampa Bay | Moved from Tampa Bay | Net gain |
| New York | 8,728 | 2,986 | +5,742 |
| New Jersey | 4,539 | 1,023 | +3,516 |
| California | 4,002 | 1,947 | +2,055 |
| Illinois | 3,295 | 1,452 | +1,843 |
| Pennsylvania | 3,212 | 1,444 | +1,768 |
| Massachusetts | 2,517 | 1,182 | +1,335 |
| Virginia | 2,725 | 1,515 | +1,210 |
| Maryland | 1,869 | 826 | +1,043 |
Source: IRS Statistics of Income, county-to-county migration data, 2022–2023. People counted on tax returns that changed address between the 2022 and 2023 filing years, four Tampa Bay counties combined. Moves between the four counties are excluded.
These state figures are lower bounds. The IRS doesn’t assign a county-to-county flow to a state when it has fewer than 20 returns, and about a third of moves in from other states, and nearly half of moves out, fall in that group.
Where do people go when they leave Tampa Bay?
On net, Tampa Bay loses people to North Carolina, South Carolina, Tennessee, Georgia and Texas, and within Florida to Polk, Citrus and Marion counties. North Carolina took 3,290 people from Tampa Bay and sent 2,344, a net loss of 946.
| Destination | Moved from Tampa Bay | Moved to Tampa Bay | Net loss |
| North Carolina | 3,290 | 2,344 | −946 |
| South Carolina | 1,623 | 979 | −644 |
| Tennessee | 1,844 | 1,490 | −354 |
| Georgia | 3,379 | 3,059 | −320 |
| Texas | 4,158 | 3,856 | −302 |
| Polk County, FL | 7,862 | 5,228 | −2,634 |
| Citrus County, FL | 2,598 | 1,134 | −1,464 |
| Marion County, FL | 1,824 | 1,024 | −800 |
| Manatee County, FL | 4,202 | 3,656 | −546 |
Source: IRS Statistics of Income, county-to-county migration data, 2022–2023, four Tampa Bay counties combined.
Polk alone took 7,862 people from Tampa Bay, more than any state in these tables. Moves within Florida balance out almost exactly: 41,896 people came from other Florida counties and 41,891 left for them. Tampa Bay gained from Miami-Dade (+2,237), Broward (+1,510) and Lee (+871).
How much do people moving to Tampa Bay earn?
People moving into Tampa Bay reported an average of $84,220 in adjusted gross income per tax return, 24% more than the $68,093 reported by people moving out, according to IRS data for 2022 to 2023. Together, newcomers brought $7.07 billion in income and leavers took $4.87 billion, a net gain of $2.2 billion.
| IRS migration, 2022–2023 | Moved in | Moved out | Net |
| People | 138,633 | 117,745 | +20,888 |
| Tax returns | 83,919 | 71,473 | +12,446 |
| Total income (AGI) | $7.07 billion | $4.87 billion | +$2.20 billion |
| Average income per return | $84,220 | $68,093 | +24% |
| From or to other states | 94,041 | 73,621 | +20,420 |
| From or to other Florida counties | 41,896 | 41,891 | +5 |
| From or to abroad | 2,696 | 2,233 | +463 |
Source: IRS Statistics of Income, county-to-county migration data, 2022–2023, flows into and out of Hillsborough, Pinellas, Pasco and Hernando combined. Averages calculated by The Rothfuss Team Realty.
IRS data counts people who file tax returns and their dependents, so it misses some movers, like many retirees with no filing requirement and people arriving from abroad without a U.S. return. It’s still the only public source that shows where movers come from and what they earn.
What do the migration numbers mean for buyers and sellers?
Fewer net arrivals from other states has come at the same time as more homes for sale and more price cuts in Tampa Bay. The four counties had 18,158 active listings in October 2026, nearly four times the 4,691 of October 2021, and 25.9% of metro listings had a price cut, according to Realtor.com.
- Buyers moving here have more choice and more room to negotiate than in 2021 or 2022. Use the time to compare flood zones, insurance and CDD and HOA fees before you pick an area.
- Sellers in Hillsborough and Pinellas are competing with more listings and fewer out-of-state buyers than a few years ago. Price from recent closed sales, not from the 2022 market. See our Florida home price cut statistics.
- Pasco and Hernando are still drawing domestic movers, many into new construction. Compare new construction and resale before you sign with a builder.
If you’re planning a move, start with our relocating to Tampa guide and where to live in Tampa.
Moving to Tampa Bay statistics at a glance
Statistic | Latest value | Source, period |
Tampa Bay population (4 counties) | 3,418,895 | Census Bureau, July 1, 2025 |
Population change since April 2020 | +243,613 (+7.7%) | Census Bureau, 2020–2025 |
Net migration | +16,874 | Census Bureau, year to July 1, 2025 |
Net domestic migration | −1,539 (+53,738 in 2022) | Census Bureau, year to July 1, 2025 |
Net international migration | +18,413 | Census Bureau, year to July 1, 2025 |
Fastest-growing county | Pasco, +20.0% since 2020 | Census Bureau, 2020–2025 |
Pasco domestic gain (Florida rank) | +18,078 (2nd of 67) | Census Bureau, year to July 1, 2025 |
Hillsborough domestic loss (Florida rank) | −15,620 (4th largest loss) | Census Bureau, year to July 1, 2025 |
People moving in / out (outside the 4 counties) | 138,633 / 117,745 | IRS, 2022–2023 |
Largest net source state | New York, +5,742 people | IRS, 2022–2023 |
Largest net destination state | North Carolina, −946 people | IRS, 2022–2023 |
Average income per return, in vs. out | $84,220 vs. $68,093 | IRS, 2022–2023 |
Cite this page
You’re welcome to use these statistics with a link back to this page:
The Rothfuss Team Realty. “Moving to Tampa Bay Statistics (2026): Who’s Moving In and Who’s Leaving.” Updated November 12, 2026. https://rothfussteamrealty.com/blog/moving-to-tampa-bay-statistics/
The four-county totals, Florida county rankings, per-day figures and income averages are our own calculations from Census Bureau and IRS public data. Journalists can contact James for comment. For population, jobs and housing numbers, see our Tampa Bay statistics page.
“Fewer people are arriving from other states than in 2022, and buyers who are relocating feel that as more choice. Take the time to compare counties on insurance, flood risk and commute before you commit to one.”
— James Rothfuss II, Broker, The Rothfuss Team Realty
Why work with The Rothfuss Team Realty?
We help people moving to Tampa Bay choose the right county and home before they arrive. Broker James Rothfuss II works with each buyer himself.
- Side-by-side comparisons of Hillsborough, Pinellas, Pasco and Hernando by price, insurance, flood zone and commute.
- Video tours and remote showings for buyers who can’t visit yet.
- Help with Florida-specific steps: wind mitigation, 4-point inspections, homestead and CDD fees.
- Listing help for current owners who are moving out of the area.
See how buying with us works, try our Tampa home affordability calculator, or contact James.
Frequently asked questions
Migration added 16,874 people to Hillsborough, Pinellas, Pasco and Hernando counties in the year to July 1, 2025, according to the Census Bureau. That's down from 81,654 in 2022.
Official 2026 numbers come out in spring 2027. In the latest Census estimates, for the year to July 1, 2025, 15,620 more people left Hillsborough County for other U.S. places than arrived, and Pinellas had a net loss of 9,203. Tampa Bay still grew because of people arriving from abroad and moving to Pasco and Hernando.
About 380 people a day moved into Tampa Bay's four counties from elsewhere and about 323 a day moved out, based on IRS data for 2022 to 2023. In net terms, migration added about 46 people a day in the year to July 1, 2025, according to the Census Bureau.
New York is the largest net source, with 8,728 people moving to Tampa Bay and 2,986 moving the other way in IRS data for 2022 to 2023. New Jersey, California, Illinois and Pennsylvania follow. Within Florida, Tampa Bay gains the most from Miami-Dade and Broward.
Tampa Bay loses more people than it gains to North Carolina, South Carolina, Tennessee, Georgia and Texas, IRS data shows. Within Florida, the biggest net losses are to Polk, Citrus and Marion counties.
Pasco County. It grew 20.0% from April 2020 to July 2025, to 674,516 people, and had Florida's second-largest gain from domestic moves in the year to July 1, 2025.
Yes, but slowly. The four counties grew by 13,538 people (0.4%) to 3,418,895 in the year to July 1, 2025, down from 76,202 in 2022. Pinellas lost 11,834 people that year.
Yes. In IRS data for 2022 to 2023, people moving into Tampa Bay reported $84,220 in average adjusted gross income per tax return, compared with $68,093 for people moving out, a 24% difference.

Broker and owner of The Rothfuss Team Realty. 30+ years in business and 60+ properties bought and sold across Tampa Bay.
More about the teamAsk a questionLinkedInKeep reading
 Relocation & RetirementNov 12, 2026Living in Temple Terrace, FL: Homes, Prices and What to Know (2026)
 Relocation & RetirementNov 5, 2026Pros and Cons of Living in Apollo Beach, FL (2026): 6 Pros, 6 Cons and the Real Costs
 Relocation & RetirementNov 5, 2026Moving From Omaha or Council Bluffs to Tampa (2026): Taxes, Insurance and a Step-by-Step Checklist